With the US
equities firmly setting themselves up around all time highs, the doomsday predictions
have started flowing in. This is typical scare mongering which has been
witnessed every time a prominent trend stays in place for a sustainable period
of time. Equities have been remarkably resilient this year, factoring in fallout from events like Brexit and the Trump victory. However, “While the S&P 500 is reaching all-time highs on
optimism over Donald
Trump's economic agenda, some Wall Street strategists are increasingly
worried about a widely followed valuation measure that's reached levels that
preceded most of the major market crashes of the last 100 years” , (http://www.cnbc.com/2016/12/08/market-indicator-hits-levels-last-seen-before-plunges.html
)
To be sure, the valuations have been elevated. But is that
a good enough reason for the bulls to start offloading their prized
possessions? The article says that the Shiller "cyclically adjusted
price-to-earnings ratio" (CAPE) is calculated using
price divided by the index's average historical 10-year earnings, adjusted for
inflation. Yale economics professor Robert Shiller's research found future
10-year stock market returns were negatively correlated to high CAPE
ratio readings on a relative basis. He won the Nobel Prize in economics in 2013
for his work on stock market inefficiency and valuations.
Here is the chart being refereed to…
Shiller CAPE PE Ratio
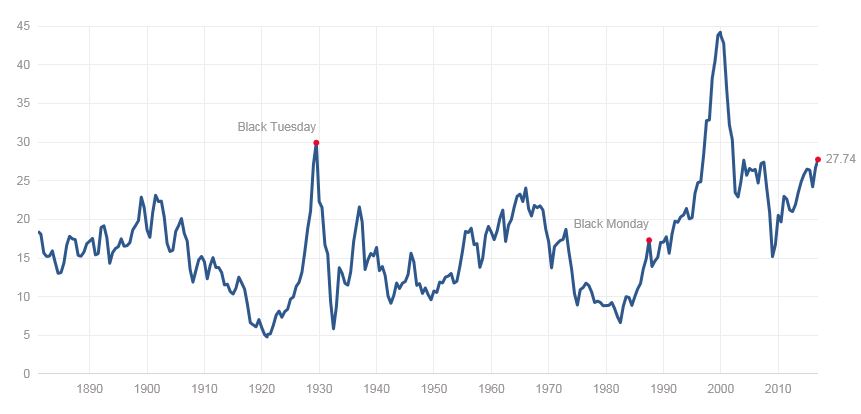
While the article is right in pointing out that the current
levels have been exceeded only thrice in last one century, the difference in absolute
values on the chart over last one decade is puzzling. The CAPE
strode up to near 45 levels at the height of the 2008 debt fueled rally. The
metric currently stands at just about 28 now. One more important point to
consider is the alarming spurt in global central bank assets. Major central
banks have witnessed a tremendous spike in their balance sheets in the aftermath
of the global financial crisis. The aggregate size of major central assets is
up from $5.5 Trillion to $18 Trillion over last eight years.
Coming back to the CAPE, it is important to note
that the value of the metric has been elevated over last two to three years. In
fact, in September 2014, when US stocks were rising in a similar manner and looking
unusually expensive, Rober Shiller himself stated that 'We saw this before the
Wall St crash, the dot-com bubble and the credit crunch". Will the CAPE hold true this time or investors would fall in a value trap? ...only time will tell! Read
more: http://www.thisismoney.co.uk/money/investing/article-2742297/PROF-ROBERT-SHILLER-INTERVIEW-How-stocks-crash-2014.html#ixzz4SLTBjsva.
.
No comments:
Post a Comment